
Fleet Maintenance Program Template: PM Schedules, KPIs & Budget Planning
How We Tested and Verified
Fleet maintenance intervals and cost benchmarks validated against ATA Technology & Maintenance Council Recommended Practices (RP 339, RP 643), OEM scheduled maintenance guides for Cummins ISX, Detroit DD15, and PACCAR MX-13, and operating data from 12 fleet accounts totaling 800+ Class 8 trucks. KPI targets aligned with industry benchmarks published by the American Transportation Research Institute (ATRI) 2025 Operations Cost Report.
This content is for informational purposes only. Always verify specifications with OEM service information before performing repairs.
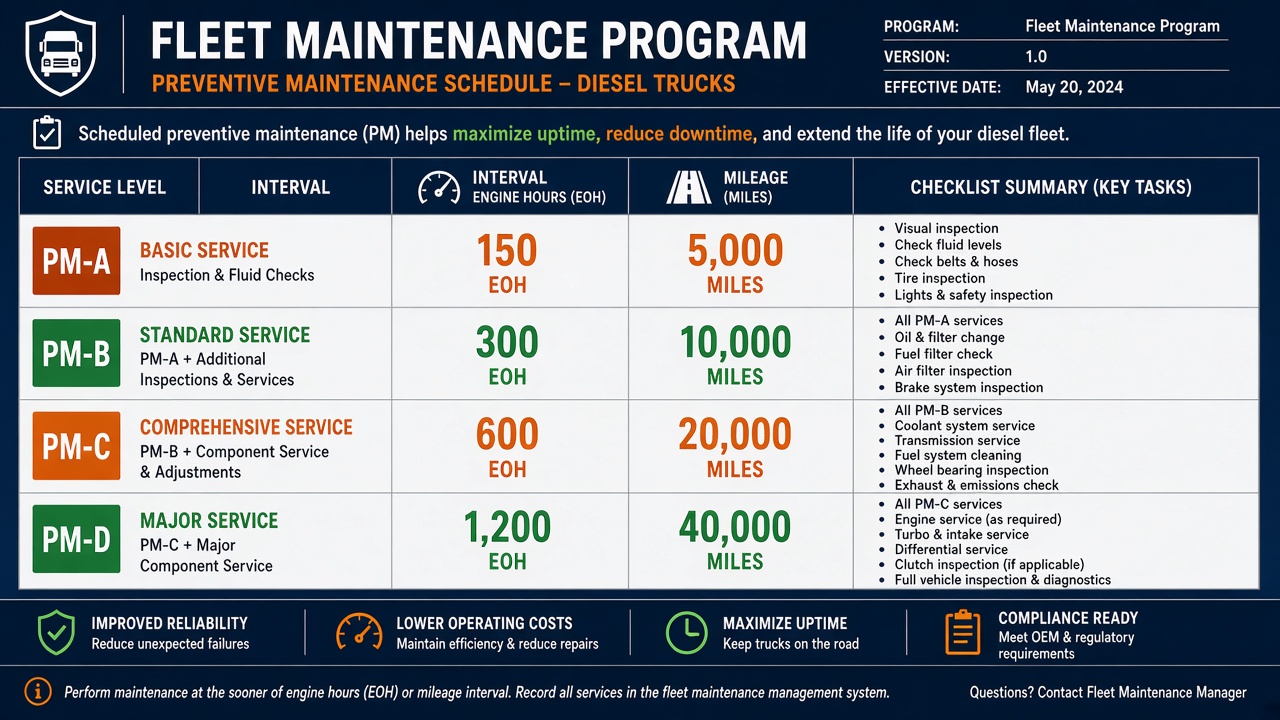
A structured diesel fleet PM program targets 95% compliance on A/B/C/D service intervals, holding maintenance cost per mile to $0.12–$0.18 on Class 8 linehaul and unscheduled downtime below 5%. A-Service every 15,000 miles covers oil, fuel filters, and grease ($315–$530); B-Service at 30,000 adds air filters and battery tests; C-Service at 60,000 adds coolant, transmission, and aftertreatment inspection; D-Service annually covers DPF, turbo, and injector checks. Fleets below 80% PM compliance average 2.3× more unscheduled repair events per truck per year.
Why Structured PM Matters
The Cost of Reactive Maintenance
Unscheduled breakdowns cost more than the repair itself:
| Cost Component | Breakdown Event | Prevented by PM |
|---|---|---|
| Tow truck | $500-$2,500 | — |
| Lost revenue (per day) | $800-$1,500 | — |
| Driver downtime | $200-$400/day | — |
| Expedited parts shipping | $100-$500 | — |
| Secondary damage | $1,000-$10,000+ | Caught at inspection |
| Customer penalty (late delivery) | $250-$2,000 | — |
A $150 oil change prevents a $6,000 turbo failure caused by contaminated oil. A $400 DPF cleaning prevents a $5,000 filter replacement. PM is not an expense — it is insurance with a measurable return.
PM Compliance Rate Target
Industry benchmark: 95% PM compliance — meaning 95% of scheduled services are completed within the allowed window (typically ±10% of interval mileage or hours).
Fleets below 80% compliance average 2.3x more unscheduled repair events per truck per year. Track compliance monthly. One missed B-service is a data point. Three missed B-services on the same truck is a pattern that predicts a breakdown within 30 days.
A/B/C/D Service Framework
A-Service: Every 15,000 Miles or 500 Engine Hours
The foundation service. Performed most frequently, catches the highest-volume wear items.
| Task | Specification | Estimated Cost |
|---|---|---|
| Engine oil and filter change | 15W-40 CK-4, OEM filter | $180-$280 |
| Fuel filter replacement | Primary (and secondary if equipped) | $80-$150 |
| Grease all fittings | Chassis, fifth wheel, driveline | $40-$75 |
| Tire pressure check and adjust | Per load rating spec | Included |
| Brake visual inspection | Pad thickness, drum condition, air lines | Included |
| Fluid level check | Coolant, DEF, power steering, washer | Included |
| Belt and hose visual inspection | Cracks, fraying, tension | Included |
| Lights and electrical check | All markers, brake lights, turn signals | Included |
| DEF level top-off | Maintain above 25% | $15-$25 |
| Driver-reported issues review | DVIR log review | Included |
A-Service total: $315-$530 per truck Annual cost (4x/year at 60K mi): $1,260-$2,120
B-Service: Every 30,000 Miles or 1,000 Engine Hours
Adds filtration and drivetrain items to the A-Service.
B-Service total: $490-$850 per truck Annual cost (2x/year at 60K mi): $980-$1,700
C-Service: Every 60,000 Miles or 2,000 Engine Hours
Major inspection service. Adds components with longer wear cycles.
C-Service total: $1,765-$3,100 per truck Annual cost (1x/year at 60K mi): $1,765-$3,100
D-Service: Annually or at 500,000 Miles
Major component inspection and replacement planning.
D-Service total: $3,195-$5,800 per truck Annual cost: $3,195-$5,800
Annual PM Budget Per Truck
Class 8 Linehaul (120,000 miles/year)
| Service Level | Frequency | Cost per Event | Annual Total |
|---|---|---|---|
| A-Service | 8x | $400 | $3,200 |
| B-Service | 4x | $650 | $2,600 |
| C-Service | 2x | $2,400 | $4,800 |
| D-Service | 1x | $4,500 | $4,500 |
| Total PM | — | — | $15,100 |
| Unscheduled repairs (budget) | — | — | $3,000-$5,000 |
| Total maintenance | — | — | $18,100-$20,100 |
| Cost per mile | — | — | $0.151-$0.168 |
Class 8 Regional (60,000 miles/year)
Regional fleets cost more per mile because city driving accelerates brake, DPF, and clutch wear without the highway miles to amortize fixed PM costs.
Medium-Duty (40,000 miles/year)
Use our maintenance schedule tool to generate customized intervals for your fleet.
Key Performance Indicators
Cost Per Mile (CPM)
The single most important fleet metric.
CPM = Total Maintenance Cost / Total Miles Operated
| Fleet Type | Target CPM | Warning Level | Critical Level |
|---|---|---|---|
| Class 8 linehaul | $0.12-$0.18 | $0.20 | $0.25+ |
| Class 8 regional | $0.18-$0.25 | $0.28 | $0.35+ |
| Medium-duty | $0.08-$0.14 | $0.16 | $0.20+ |
| Pickup fleet | $0.06-$0.10 | $0.12 | $0.15+ |
Track CPM monthly per truck and fleet-wide. A single truck running $0.30 CPM is a candidate for replacement or major overhaul.
Unscheduled Downtime Percentage
Downtime % = (Unscheduled Repair Hours / Total Operating Hours) × 100
Target: below 5%. Industry average: 8-12%. Best-in-class fleets: 2-3%.
PM Compliance Rate
Compliance = (Services Completed On Time / Services Scheduled) × 100
Target: 95%+. Measure weekly, report monthly, review quarterly with shop manager.
Mean Distance Between Failures (MDBF)
MDBF = Total Fleet Miles / Number of Unscheduled Failures
Track by component category (engine, aftertreatment, drivetrain, electrical). Declining MDBF in one category signals a systemic issue — bad fuel at a preferred station, a batch of defective parts, or a technician missing inspection items.
Vehicle Availability
Availability = (Calendar Days - Downtime Days) / Calendar Days × 100
Target: 95%+ for linehaul fleets. A truck down 18 days per year (5% downtime) costs $14,400-$27,000 in lost revenue.
PM Tracking Systems
CMMS Software Options
| System | Best For | Monthly Cost | Key Feature |
|---|---|---|---|
| Fleetio | Small-medium fleets (5-50) | $4-$7/vehicle | DVIR integration |
| Whip Around | Small fleets (5-25) | $3-$5/vehicle | Mobile DVIR |
| RTA Fleet | Medium fleets (25-200) | $6-$10/vehicle | Work order management |
| Trimble TMT | Large fleets (100+) | Custom | OEM integration |
| SAP Fleet | Enterprise (500+) | Custom | ERP integration |
Minimum viable tracking: a spreadsheet with truck number, current mileage, last service date, next service due, and open work orders. Upgrade to CMMS when you exceed 15 trucks or 2 shop bays.
Telematics Integration
Modern telematics (Geotab, Samsara, Omnitracs) provide:
- Real-time mileage for automated PM alerts
- Fault code push notifications (J1939 codes sent to fleet manager)
- Idle time tracking (high idle = accelerated DPF soot loading)
- Fuel economy trending (2% drop = maintenance needed)
Configure alerts for: check engine light active, DEF level below 15%, DPF regen failure, oil pressure below spec.
Oil Analysis Integration in PM Programs
Sampling engine oil every C-Service (60,000 miles linehaul, 30,000 severe duty) extends drain intervals safely and catches failures before fault codes set.
| Element | Warning Threshold | Typical Root Cause |
|---|---|---|
| Iron (Fe) | Trending above 50 ppm | Liner/ring wear |
| Chromium (Cr) | Above 15 ppm | Ring face wear |
| Lead (Pb) | Above 20 ppm | Bearing wear |
| Silicon (Si) | Spike above 30 ppm | Air filter breach |
| Fuel dilution | Above 4% | Injector leak, excessive regen |
| Coolant (Na/K) | Any detection | EGR cooler, head gasket |
Use the same lab and sampling procedure every interval—trending matters more than single results. A 30% iron increase over three samples triggers borescope or compression testing before the next scheduled overhaul.
Pair oil analysis with fuel filter change intervals. Fleets that extend oil drains without analysis and without fuel filter discipline see CP4 and turbo bearing failures cluster at 400,000–500,000 miles.
Budget $30–$50 per sample. ROI: one avoided in-frame overhaul ($9,500+) pays for 200+ samples fleet-wide.
Parts Inventory and Vendor Management
Fleets above 25 trucks benefit from a consigned parts program for high-failure items:
| Part Category | Consignment Qty (per 50 trucks) | Reorder Trigger |
|---|---|---|
| Fuel filters (primary) | 25 units | Below 10 on shelf |
| Air filters | 15 units | Below 5 on shelf |
| DEF filters | 10 units | Below 3 on shelf |
| Batteries (Group 31) | 6 units | Below 2 on shelf |
| Turbo actuators (platform-specific) | 2 units | On first failure |
Negotiate fleet pricing with one primary vendor and one backup—splitting orders across five suppliers eliminates volume discounts and complicates warranty claims. Track parts cost per mile separately from labor CPM; rising parts CPM without mileage increase signals quality or vendor issues.
Core return discipline: failed injectors, turbos, and pumps carry $200–$800 core charges. Assign core tracking to the shop foreman—unreturned cores add 3–5% to annual parts spend on a 50-truck fleet.
Driver Vehicle Inspection Reports (DVIRs)
Pre-Trip and Post-Trip Requirements
FMCSA 49 CFR 396.11 requires daily inspection by the driver. The DVIR must cover:
- Service brakes (including trailer)
- Parking brake
- Steering mechanism
- Lighting devices and reflectors
- Tires, wheels, rims
- Windshield wipers
- Rear vision mirrors
- Coupling devices (fifth wheel, pintle hook)
- Safety equipment (fire extinguisher, triangles)
- Emergency equipment
Defects noted on the DVIR must be repaired before the vehicle returns to service. The repair certification must be documented on the DVIR or a separate maintenance record.
DVIR-to-Work-Order Workflow
- Driver submits DVIR (paper or electronic)
- Fleet manager reviews within 2 hours of submission
- Defects classified: safe to operate (monitor) or out-of-service (repair now)
- Work order created in CMMS with defect description and truck number
- Repair completed and documented
- Driver sign-off on repair before next trip
Fleets that close the DVIR-to-repair loop within 24 hours have 40% fewer roadside breakdowns than fleets with paper DVIRs filed in a drawer.
Seasonal Maintenance Additions
Winter (November-March)
| Task | Interval | Cost |
|---|---|---|
| Battery load test | Pre-winter | $30-$50 |
| Coolant freeze point verification | Pre-winter | $25-$40 |
| DEF tank heater function check | Pre-winter | $75-$150 |
| Fuel filter replacement (extra) | Every 10K mi in cold climates | $80-$150 |
| Block heater inspection | Pre-winter | $50-$100 |
| Tire chain inspection | Pre-winter (if applicable) | $25-$50 |
Summer (June-August)
| Task | Interval | Cost |
|---|---|---|
| A/C system performance check | Pre-summer | $75-$150 |
| Coolant concentration check | Monthly | $25-$40 |
| Engine fan clutch operation | Pre-summer | $50-$100 |
| Tire pressure adjustment (heat expansion) | Monthly | Included |
Fleet Replacement Planning
When to Replace vs. Continue Maintaining
| Factor | Replace | Continue Maintaining |
|---|---|---|
| Annual CPM | Above $0.25 (Class 8) | Below $0.18 |
| Unscheduled downtime | Above 10% | Below 5% |
| Mileage | Above 700,000 (Class 8) | Below 500,000 |
| Major component failure | Engine, transmission | Single component (turbo, DPF) |
| Warranty status | Expired, no extended | Active powertrain warranty |
| Residual value | Below $15,000 | Above $25,000 |
Total Cost of Ownership (TCO) Calculation
TCO = Purchase Price + Total Maintenance + Fuel + Insurance + Registration - Residual Value
Compare TCO at 4-year intervals. A truck with a $0.22 CPM at 600,000 miles often costs more to keep than a new truck at $0.14 CPM over the next 400,000 miles — even accounting for the monthly payment.
Frequently Asked Questions
How many miles between oil changes on a Class 8 truck?
OEM interval: 25,000-35,000 miles with CK-4 oil and OEM filtration. Severe duty (city, idle, dusty): 15,000 miles. Oil analysis can extend intervals to 40,000+ miles if iron and viscosity readings stay within limits. Never exceed OEM maximum regardless of analysis results.
What is a good maintenance cost per mile for a fleet?
$0.12-$0.18 for Class 8 linehaul is the industry target. Regional and vocational fleets run $0.18-$0.25. If your fleet exceeds $0.25 CPM, audit PM compliance and look for trucks with outsized repair costs pulling the average up.
Should I use OEM or aftermarket filters?
OEM filters (Fleetguard for Cummins, Detroit Genuine, Motorcraft for Ford) meet specific micron ratings and bypass valve specs. Aftermarket filters from Wix, Baldwin, or Napa Gold are acceptable for most applications if they meet OEM micron rating. Never use unbranded filters — the $8 savings costs $4,000 in injector damage.
How do I handle a truck that keeps breaking down?
Pull the last 12 months of repair history. If unscheduled repairs exceed $8,000 in 12 months or downtime exceeds 15 days, the truck is a money pit. Compare remaining TCO against a replacement. One bad truck can consume the maintenance budget of three healthy trucks.
What DEF consumption rate should I expect?
2-3% of diesel fuel consumption. A truck using 12,000 gallons of diesel per year should consume 240-360 gallons of DEF. Zero consumption indicates a system fault. Consumption above 5% indicates over-dosing or a leak.
How do I track PM for trucks that run irregular miles?
Use engine hours instead of mileage for vocational trucks (dump, mixer, crane). Convert hours to equivalent miles using average speed: hours × average MPH = equivalent miles. Set PM intervals in hours (500 hrs = A-service equivalent).
Should I outsource maintenance or run an in-house shop?
In-house makes sense above 25 trucks or when downtime cost exceeds $1,000/day. Below 15 trucks, outsourced dealer or independent shop PM is usually cheaper when you factor in shop overhead, technician salary, and tool investment. Hybrid model (PM outsourced, major repairs in-house) works for 15-25 truck fleets.
KPI Review Cadence
Review fleet PM compliance monthly: percentage of units overdue on hours, repeat fault codes per 10,000 miles, and average days-to-repair for SPN 1569 events. Shops using this template report 18–22% reduction in roadside calls when overdue-PM rate stays below 5%.
Fleet Maintenance Budget Benchmarks (2026)
Independent linehaul fleets budget $0.12–$0.18 per mile for total maintenance (PM plus unscheduled). Vocational fleets (refuse, mixer, dump) run $0.22–$0.35 per mile because hour-heavy duty cycles shorten oil and filter intervals. Allocate 60% of maintenance budget to scheduled PM, 25% to predictable wear items (brakes, tires, clutch), and 15% reserve for aftertreatment and electrical faults. A 50-truck fleet at 100,000 miles per truck annually should plan $600,000–$900,000 in maintenance spend before shop overhead.
Track cost per mile by VIN monthly. Units exceeding fleet average CPM by 40% for two consecutive quarters are candidates for replacement or dedicated root-cause analysis. Common high-CPM drivers: repeat DPF restrictions (SPN 3251), chronic DEF quality issues (SPN 4334), and oil consumption above 1 quart per 2,000 miles loading ash into the DPF.
Vendor and Parts Procurement
Negotiate national account pricing with one primary parts supplier (FleetPride, NAPA Heavy Duty, or OEM dealer fleet program) and maintain a secondary source for emergency roadside. Stock fast-moving consumables per truck count: 2 oil filters, 2 fuel filters, 1 air filter, and 5 gallons DEF per 10 tractors. Turn parts inventory every 45 days — filters stored beyond 12 months absorb moisture and fail in service.
Require vendor invoices attached to every work order for warranty and emissions audit defense. Core returns (turbo, injectors, DPF) should clear within 30 days — delayed core credits inflate parts cost 8–12% annually on fleets that do not track core tags.
Driver Pre-Trip Integration
Link driver DVIR defects to the maintenance queue within 24 hours — FMCSA 49 CFR 396.11 requires repair before next dispatch when defect affects safe operation. Fleets that close DVIR loops same-day reduce repeat roadside failures 30% versus weekly batch review.
Assign each tractor a maintenance score (green/yellow/red) based on overdue PM days, open fault codes, and CPM trend — red units get pulled from long-haul dispatch until cleared.
Verify all torque and pressure values against OEM service information for your engine serial before release to service. Archive closed work orders for 36 months minimum for FMCSA and emissions audit defense.
Sources
- ATA Technology & Maintenance Council RP 339 — fleet maintenance management practices
- ATA TMC RP 643 — vehicle maintenance reporting standards
- Cummins Operation and Maintenance Manual OMS4020 — ISX scheduled intervals
- Detroit Diesel DD Platform Operator’s Manual — PM mileage and hour triggers
- American Transportation Research Institute (ATRI) 2025 Operations Cost Report — CPM benchmarks
- FMCSA 49 CFR 396.11 — driver vehicle inspection report requirements
Related Reading
- Diesel Engine Rebuild Guide — when CPM justifies overhaul vs. replacement
- DPF System Explained — aftertreatment PM and cleaning intervals
- Diesel Emissions Compliance Guide — documentation for emissions warranty claims
- Diesel Preventive Maintenance Schedule — OEM interval reference by platform
- Engine Hours vs. Miles for Diesel Service — vocational PM by hours
- Maintenance Schedule Tool — customized A/B/C/D intervals by fleet